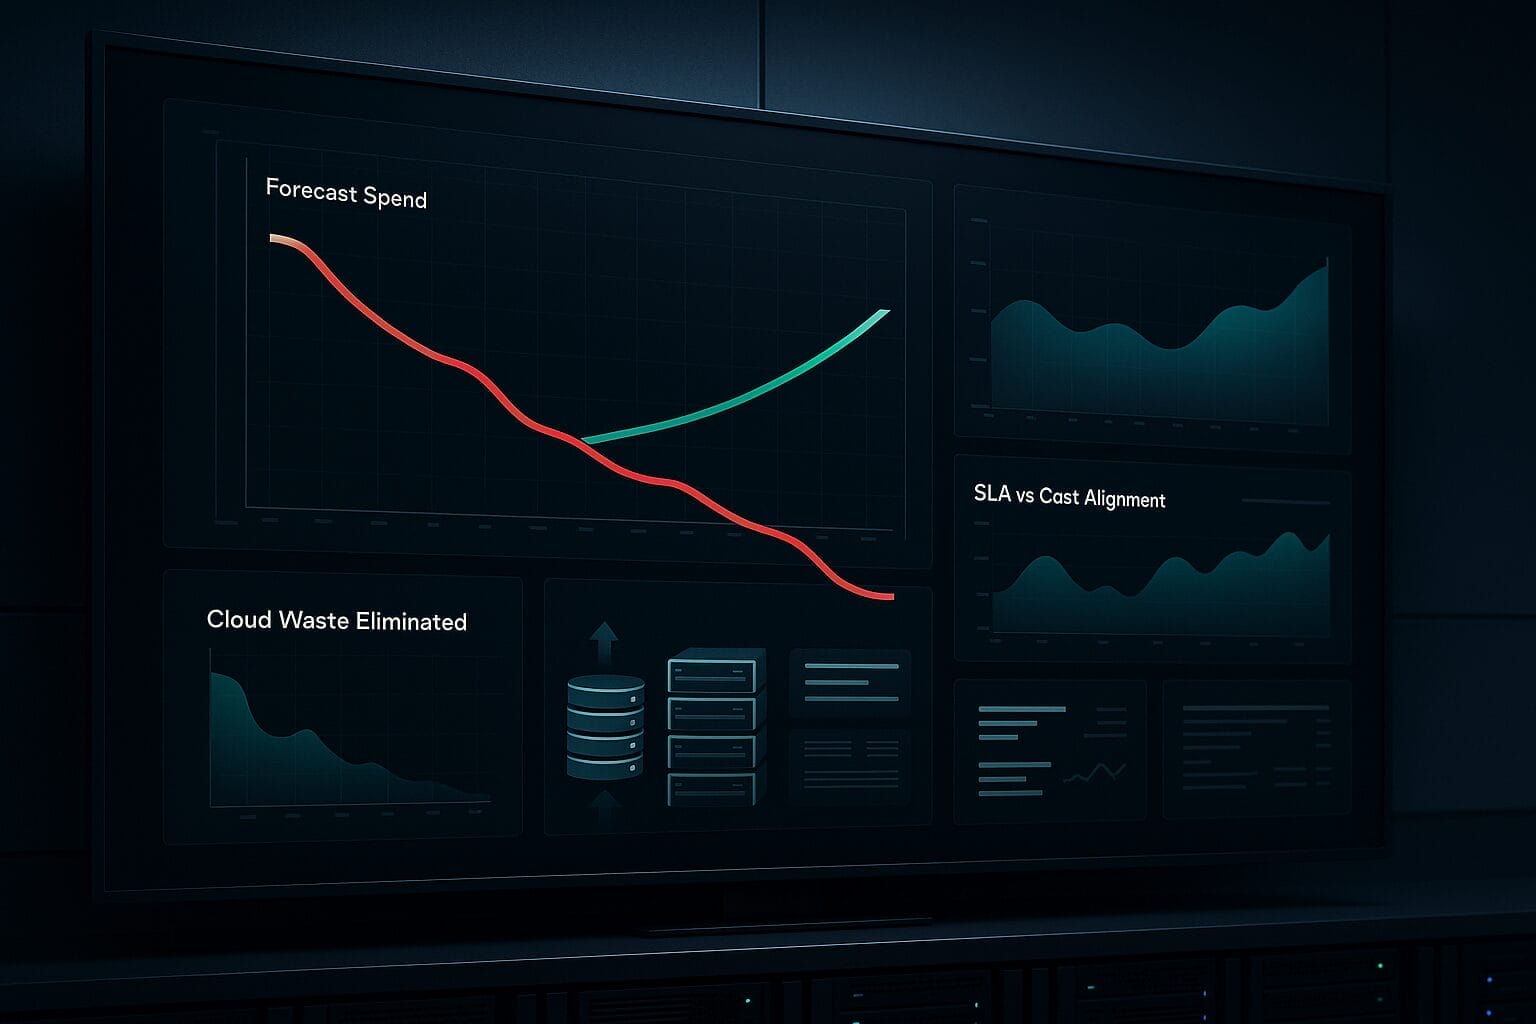
A digital FinOps dashboard displays charts on forecast spend, cloud waste elimination, and SLA cost alignment, featuring a prominent downward red line and upward green line graph.
A digital FinOps dashboard displays charts on forecast spend, cloud waste elimination, and SLA cost alignment, featuring a prominent downward red line and upward green line graph.